Methodology
Where the Odds Come From
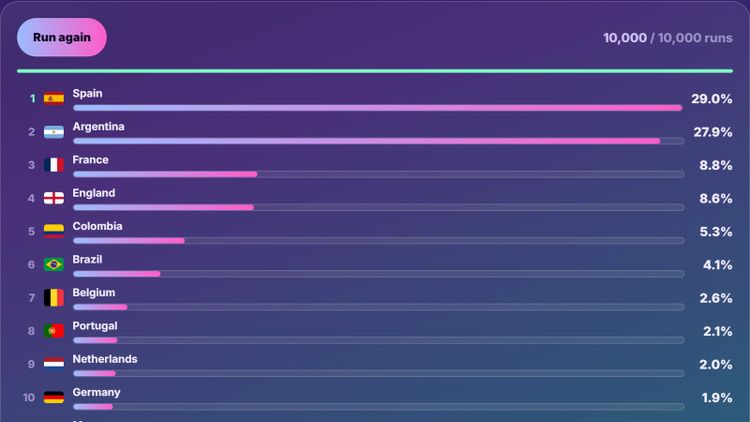
How the dashboard's title odds are made: an interactive tour of Monte-Carlo simulation, the Law of Large Numbers, and why thousands of simulated tournaments beat one prediction.
Insights
Datagedreven analyses en dashboards van SolvX, die echte gebeurtenissen vertalen naar praktisch inzicht.
Resultaten: 4 insights
Methodology
How the dashboard's title odds are made: an interactive tour of Monte-Carlo simulation, the Law of Large Numbers, and why thousands of simulated tournaments beat one prediction.
Interactive Insight
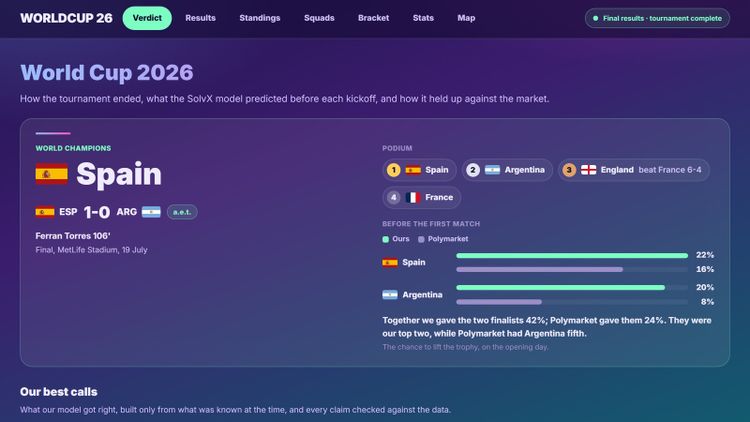
The World Cup 2026 in full, and how our title and match predictions compared with the market and with what happened.
Finance
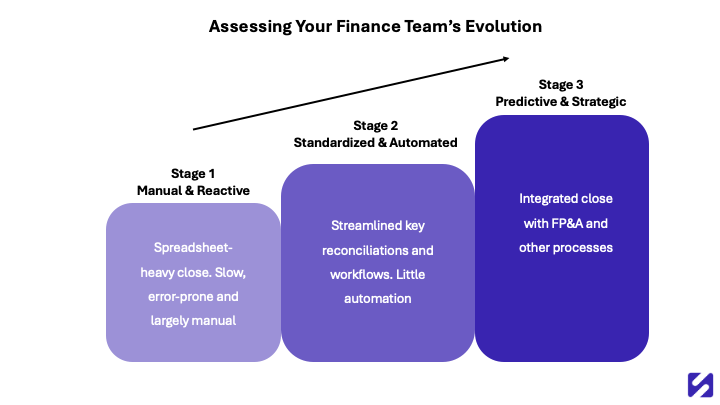
Dit artikel volgt de weg van een maandafsluiting vol spreadsheets naar een snellere, continue close: de volwassenheidscurve, het doorbreken van datasilo's, de inzet van AI en concrete stappen die efficiëntie omzetten in strategische waarde.
Interactive Insight
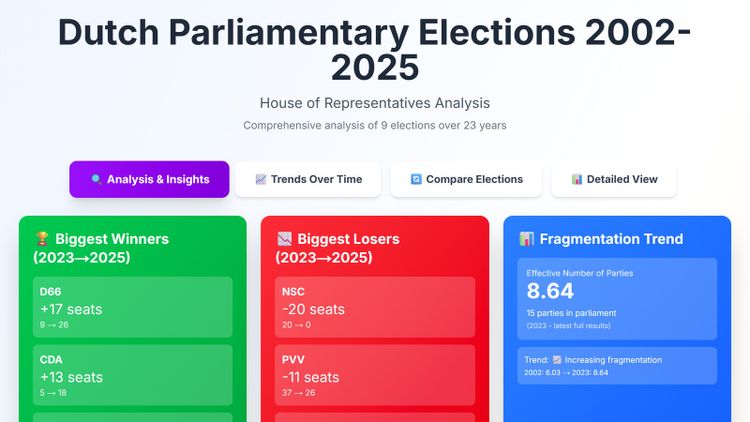
Interactive visualisations tracking the election trends to showcase data storytelling techniques.