Customer case · MSF Transformational Investment Capacity
MSF TIC: One Version of the Truth
The Transformational Investment Capacity invests in projects that change how Médecins Sans Frontières works. Its portfolio lived in one complicated Excel workbook, maintained by hand, where the same facts were written down on several sheets and drifted apart. We rebuilt it as a proper data model with branded dashboards on top, so every number has exactly one home.
A real customer project. Every project, value and count in the examples is illustrative; no real TIC data is shown.
Investing in how MSF transforms
The Transformational Investment Capacity, TIC, is an international body within MSF that invests in projects meant to transform the way the movement works: new ways of delivering care, new tools, new shared services. Proposals come in from operational centres, sections and country programmes, are reviewed and approved, and then run in phases until they are absorbed, handed over or closed.
Following that portfolio means tracking a lot at once: the pipeline of proposals, every project's phases and milestones, the people around it, and the money, from approved budget to forecast and actual spend, against the yearly envelope of the fund.
The same fact, on every sheet
All of that lived in one Excel workbook, maintained by hand. It had grown sheet by sheet, and the same data was written down in several places: the project lead on the projects sheet, again in the change log and again in the people list; the budget on the projects sheet and again on the finance sheet. Every update had to be made in every place, by hand, and it rarely was.
So the sheets drifted out of sync, and nobody could say which version was right. Make a few changes below, the way people did, and count the versions of the truth.
Pick a change to make.
One home for every number
We rebuilt the workbook as a data model. Every project has one id, and every other sheet points back to it. Each fact has exactly one home: people and their roles on the people sheet, money on the finance sheet, the proposal history on the pipeline sheet. Events, such as an approval, a review or a phase change, are appended to a change log and never overwritten, so the history stays complete and a project's current status is simply its latest event.
Excel itself stayed, because that was a requirement: it is where the team works, and nobody should need a new tool to record a decision. The data model now lives in one shared workbook on SharePoint, where everyone enters their data in the same place instead of in their own copy.
Behind that familiar surface, the workbook now guards its own data. Relationships are enforced, so a person, an event or a budget line can only point to a project that exists. Data quality checks flag a wrong entry the moment it is made, such as an end date before a start date, a missing required field or a duplicate record, so mistakes are fixed at the source instead of surfacing later in a report. And every constrained column takes its values from a list, so people pick instead of type. That matters more than it sounds: the old sheets had the same status spelled in several ways, and a dashboard counts every spelling as a different status. Switch the dropdowns on below.
5 statuses on the dashboard Where people meant two.
Dashboards in TIC's own colours
On top of the model we built a Power BI semantic model and two reports. The internal report has more than twenty pages across the portfolio, single projects, the pipeline, finance and people: from where projects come from and where they end up, to the envelope of the fund against what is spent and forecast. The external report is a shorter cut for a wider audience inside MSF, with an introduction and a glossary of every term. For readers outside the programme, labels such as a project status explain themselves on hover, in the same words as the glossary, so no label on the page has to grow longer.
Both carry TIC's own visual identity, so they read as TIC's reports, not a generic template. Click through a small replica below, with made-up numbers.
- Section or other entity42 (53%)
- Operational directors31 (39%)
- Country programme6 (8%)
Everyone on the project, the same overview
The two reports have different readers. The internal dashboard is for TIC itself: the secretariat and the committees that steer the fund, with every page on money, people and pipeline. The external dashboard is the one TIC can share with everyone else: the project managers, sponsors, accompaniers and colleagues in the sections who work on the projects. It is not a second report to maintain: a script builds it from the internal one, copying its pages exactly, so the two can never drift apart. TIC's branding is applied the same way, generated from one unbranded content layer.
That changed more than the reporting. For the first time, everyone working on a TIC project could see the same picture: who is involved, which milestones are coming, how the budget is being used, and how their project sits in the portfolio. Below are two of the pages people use most, recreated with invented projects, people and numbers.
The accompaniment matrix is not a standard Power BI visual. No built-in chart could show projects against people with a colour per role, so a DAX measure writes the whole page as HTML: the table, its styling, the colour coding and headers that stay in view while you scroll. Because the assignments sit in a table that no slicer can reach, the measure reads the slicers itself and applies them, showing current assignments by default and the history on request.
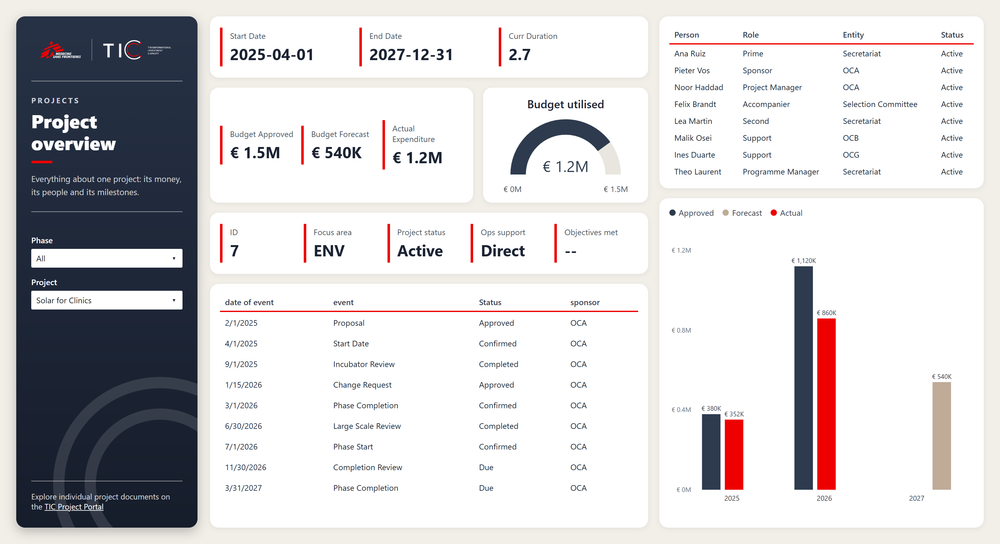
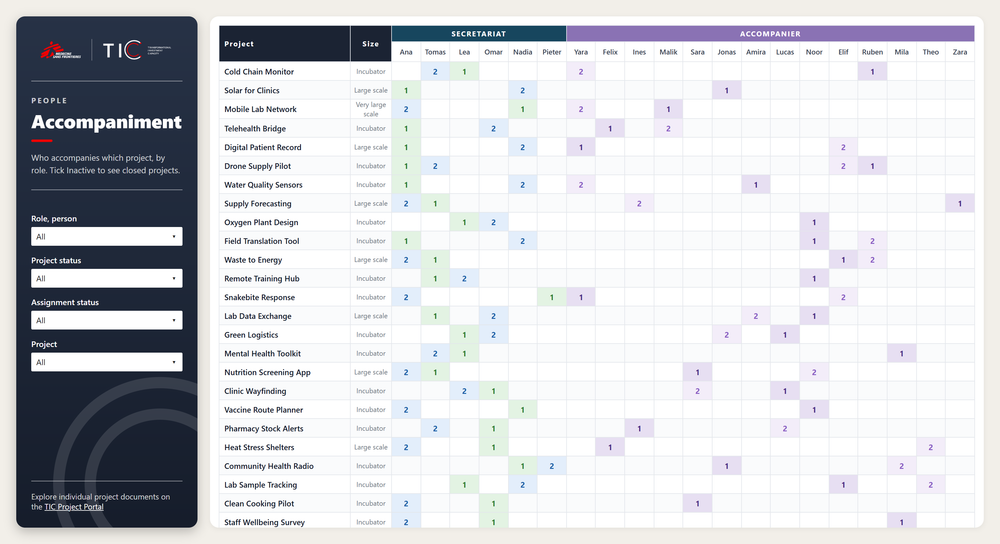
Recreated with invented data. No real TIC projects, people or figures are shown.
Decisions on numbers people trust
Today every number in TIC's reporting has one source. A change is made once and shows up everywhere; the history of every project is complete; and the dashboards show the portfolio, the pipeline and the fund as they are, not as they were the last time someone copied a value across. The time once spent reconciling sheets now goes into the conversations the numbers are for.
The reports themselves are guarded as carefully as the data. Before every publish, a check catches the mistakes Power BI does not warn about, such as a report quietly opening on the wrong page because that was the last page someone looked at. Every number is checked against an independent recount, and measures nothing uses any more are found and cleaned up.
What we delivered
- A data model for the TIC portfolio: one id per project, one home per fact, and every sheet linked to the projects sheet.
- An append-only change log, so each project keeps its full history and its current status follows from its latest event.
- One shared Excel workbook on SharePoint as the single place where everyone enters data, as TIC required.
- Enforced relationships and data quality checks that flag a wrong entry the moment it is made.
- Dropdowns fed from one list of allowed values, so a status is picked, not typed.
- A Power BI semantic model with an internal report of more than twenty pages and an external report for a wider audience.
- Both reports in TIC's visual identity, with a glossary of every term, explanations on hover and links to the project documents.
- An accompaniment matrix written as HTML by a DAX measure, where no built-in visual could show it.
- An external report generated from the internal one by script, so the two always match.
- Checks before every publish, an independent recount of every number and an audit of unused measures.
Is your spreadsheet holding too much?
We turn hand-kept workbooks into data models and dashboards people can trust.